Accessing CTF files with Python
[1]:
%matplotlib inline
import matplotlib.pyplot as plt
import numpy as np
from PIL import Image
Importing and Plotting EBSD Data from CTF
To access EBSD data in CTF files, we use the ebsdtools from Philippe Pinard at https://github.com/ppinard/ebsdtools
To read a CTF file, we need ebsdtools.hkl.tango.ctfFile, which we have updated for Python3 and saved as ctfFile3.py.
[2]:
from aloe.ext.ctfFile3 import Ctf
[3]:
filename="../data/ctf/GaN_polytype_mixing.ctf"
ctf = Ctf(filename)
mapdata = ctf.getPixelArray(key='bc', phase=('=', 1), bc=('>', 10))
print(np.array(mapdata))
[153 154 153 ..., 155 156 157]
[4]:
print(ctf.getPhases())
{1: {'id': 1, 'cell_length_a': 3.189, 'cell_length_b': 3.189, 'cell_length_c': 5.185, 'cell_angle_alpha': 90.0, 'cell_angle_beta': 90.0, 'cell_angle_gamma': 120.0, 'chemical_name_mineral': 'Ga N', 'symmetry_Int_Tables_number': 186, 'publ_author_name': 'Mod. Phys. Lett. B [MPLBET], (1999), vol. 13, pages 285-290'}, 2: {'id': 2, 'cell_length_a': 4.364, 'cell_length_b': 4.364, 'cell_length_c': 4.364, 'cell_angle_alpha': 90.0, 'cell_angle_beta': 90.0, 'cell_angle_gamma': 90.0, 'chemical_name_mineral': 'Ga N', 'symmetry_Int_Tables_number': 216, 'publ_author_name': 'ICSD[67781]'}}
[5]:
ctf_map_width=ctf.getWidth()
ctf_map_height=ctf.getHeight()
print(ctf_map_height, ctf_map_width)
172 196
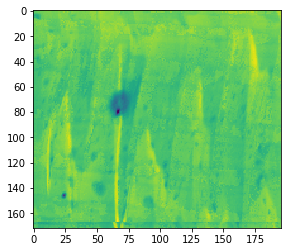
[6]:
bc=np.array(ctf.getPixelArray(key='bc', phase=('=', 1), bc=('>', 10)))
plt.imshow(bc.reshape(ctf_map_height, ctf_map_width))
plt.show()
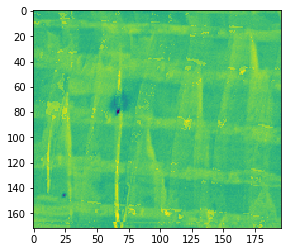
[7]:
mad=np.array(ctf.getPixelArray(key='mad'))
plt.imshow(mad.reshape(ctf_map_height, ctf_map_width))
plt.show()
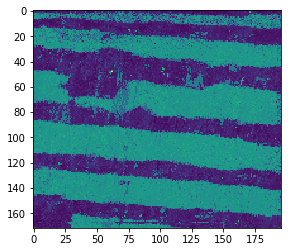
[8]:
bs=np.array(ctf.getPixelArray(key='bs'))
plt.imshow(bs.reshape(ctf_map_height, ctf_map_width))
plt.show()